
Reachability analyses are used in location planning, answering questions like "what is the immediate neighbourhood of the location, reachable on foot in 10 minutes?", or "what areas can be reached by car within a given maximum time?". They require a road network and routing algorithm, as a simple bee-line analysis will often not adequately reflect conditions on the ground.
Software for that kind of analysis is often rather expensive, as is the road network data that is used to perform the analysis on. If you need to cover a larger area, for example a 90-minute bubble around an airport, they can also take a longer time to process.
The Geofabrik Spider Graph is a convenient and inexpensive web application that allows you to create reachability analyses for any place on the planet, based on OpenStreetMap data. You start the web application, select a starting location and a few parameters - the mode of transport and a maximum travel time -, and within a few minutes you can access the result of the computation in the form of a shape file.
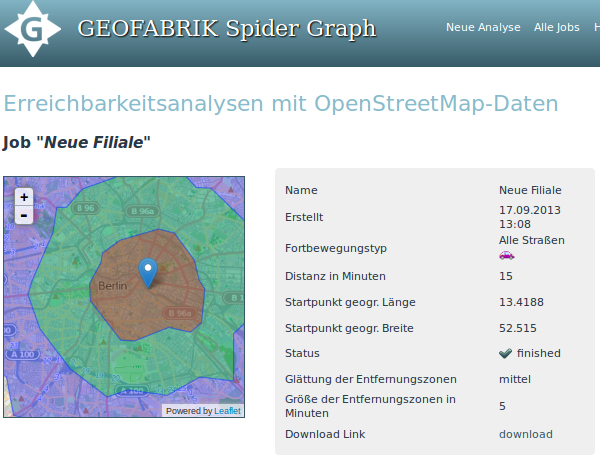
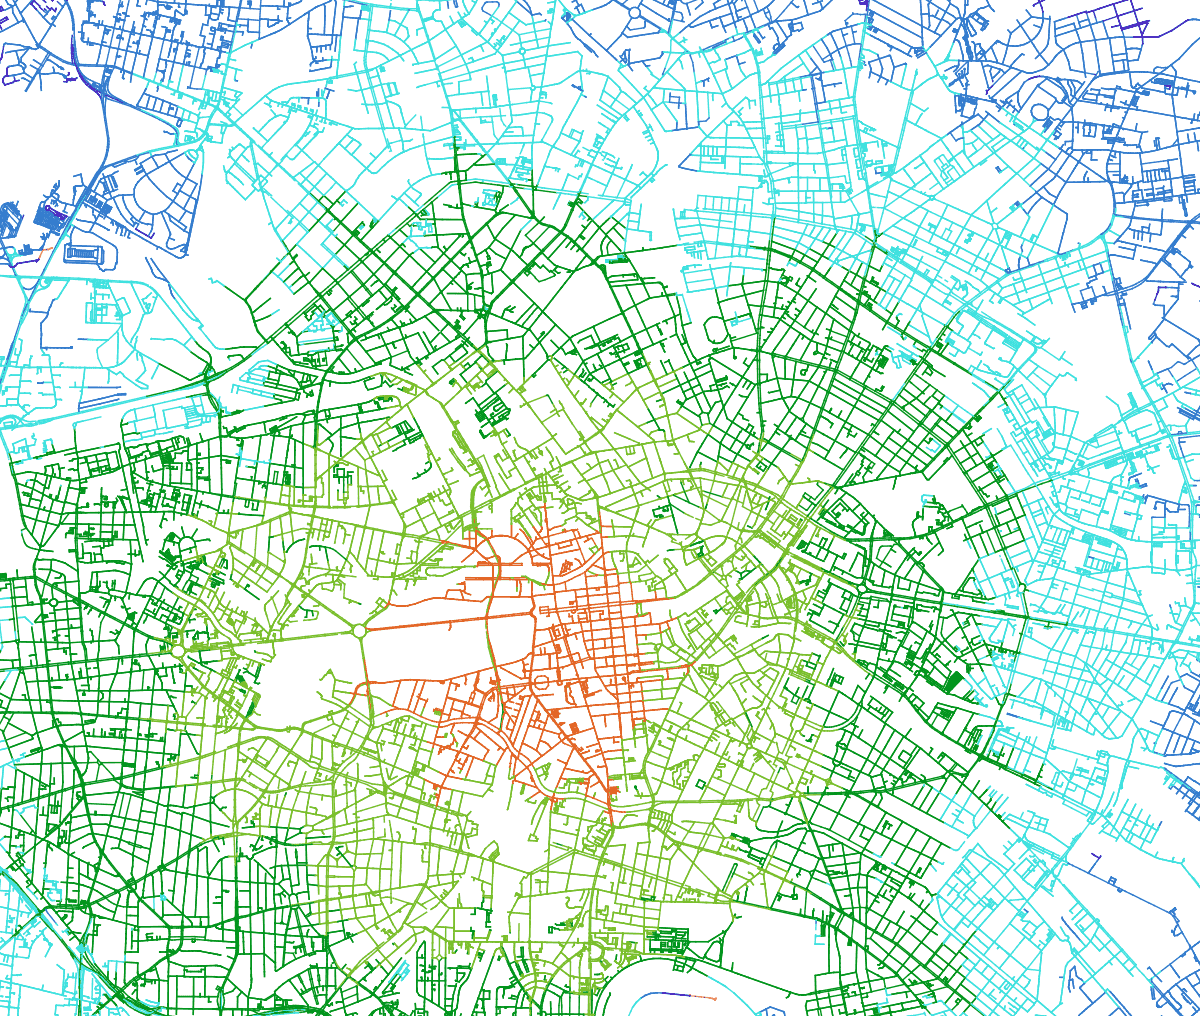
The shape file contains a spider web of streets and paths that can be used within the given time and the given mode of transport. Additionally, isochrones are provided as polygons. A time attribute in the shape file allows you to colour the resulting graph like we did in the example below.
The "Spider Graph" service is available from Geofabrik in a flat rate subscription model at EUR 35/month. Please call us or send us an e-mail if you are interested in this service. We can set up a free trial account for you.
Geofabrik Spider Graph is a web application. If you would like to retrieve isochrones from an API, we recommend our routing service based on GraphHopper which offers isochrones as well.